The soaring rate of inflation has featured prominently in the news since 2021.
The significant increase in prices, for food and energy in particular, has pushed many UK households into poverty and reliance on foodbanks as the cost-of-living crisis deepens.
Tap or click on your current salary to reveal how much you’ve lost
2025/26 salary with the Government’s 4% pay award [*]
Despite the financial suffering of public sector workers, the Conservative Government insisted that ‘inflation-busting pay rises are unaffordable’.
The pay freeze in 2021, followed in 2022 by the largest real-terms pay cut suffered by teachers since 1977, when taken in the context of crippling cost-of-living increases, has plunged many teachers into serious financial hardship.
The Labour Government’s 4% pay award in September 2025 represented another below-RPI inflation (4.5%) pay award for teachers. It will further exacerbate the recruitment and retention crisis in our schools.
In 2025/26, the majority of classroom teachers’ salaries were worth more than a quarter less in real-terms (between 26% and 30%) compared to if their pay had increased to match RPI inflation in each year since 2010. The Conservative Government’s decade of austerity, pay freezes and below-inflation pay awards have had a devastating impact on teachers’ take-home pay.
The disparity between public and private sector earnings growth since 2010
The following chart shows the extent to which the pay of classroom teachers earning the maximum amount on the main pay range (max main pay range) has fallen behind price increases, measured by both the Retail Prices Index (RPI) and Consumer Prices Index (CPI), since 2010. It also incorporates the ONS data to measure annual total pay growth in September each year since 2010 for both private sector and public sector employees.
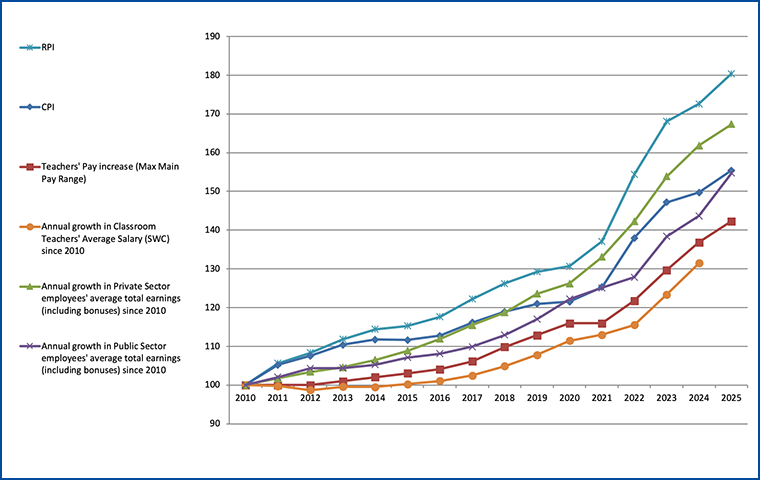
Indexed price increases compared to classroom teachers', private sector and public sector average total pay increases 2010 to 2025
The chart illustrates that since 2010:
-
the cost of living has increased by four fifths (80%) as measured by RPI and by more than half (55%) as measured by CPI;
-
average total earnings in the private sector have risen by 67%;
-
average total earnings in the public sector have risen by 55%;
-
pay for teachers at the top of the main pay range has risen by just 42%; and
-
between 2010 and 2024, classroom teachers’ average salaries grew by just 31.5% according to the Government’s School Workforce Census (SWC).
Classroom teachers are significantly poorer in real terms than they were in 2010 due to the cumulative impact of pay awards failing to match cost-of-living increases as measured by both the RPI and CPI inflation measures. Pay increases for classroom teachers have consistently been significantly lower than pay increases more generally in both the public and private sectors since 2010.
NASUWT Big Question Survey 2025
The NASUWT Big Question Survey 2025 was completed by 10,626 teachers from across England, Northern Ireland, Scotland, Wales and the Crown Dependencies.
Four in five teachers (81%) say they are worried about how they will be able to cope financially and 79% of NASUWT members do not think that teachers’ pay is competitive with comparable graduate professions. One in ten (11%) teachers reported that they have had to take a second job in the last 12 months to supplement their income. [1]
Enough is enough. Teachers deserve fair pay. Teachers need pay restoration and an above-RPI inflation pay award.
NASUWT is committed to campaigning for a New Deal for Teachers.
What is ‘inflation’?
Inflation is the rate at which the prices of goods and services bought by households rise and fall over time. Inflation is measured by using price indices, commonly referred to as RPI, CPI and CPIH. The measure of inflation used to determine wage increases, has a significant impact on your pay packet. For this reason, it’s important to understand why NASUWT and other trade unions use the Retail Prices Index (RPI) as the measure of inflation when negotiating pay increases with Governments’.
The most accurate way of measuring inflation would be to measure the change in price of every item that is purchased by every household. Since this would be impractical, the Office for National Statistics (ONS) instead tracks the prices of a selection of consumer goods and services which are believed to be representative of purchases by UK households. This is commonly referred to as the ‘basket of goods’.
One way to understand a price index is to think of a very large shopping basket containing all the goods and services typically bought by UK households. Movements in price indices, CPI, CPIH and RPI, reflect the changing cost of this representative ‘basket of goods’ over a 12-month period.
Is it true that public sector pay increases would significantly increase inflation?
No. In 2022, Andrew Bailey, Governor of the Bank of England, made this claim and urged workers not to press for extra wages. [2] The then Prime Minister Rishi Sunak made the same claim. [3]
However, claims that public sector pay significantly drives up inflation have been roundly rejected by economists from across the political spectrum, including Paul Johnson, Director of the Institute for Fiscal Studies, who argued ‘It is not true...that giving public sector workers a bit more would significantly raise inflation.’ [4]
Writing for the London School of Economics, Paul Whiteley, states unequivocally that ‘The data…does not support this idea. The correlation between public sector wage increases and inflation is negligible and not statistically significant (r=0.04). This means that public sector pay is unrelated to inflation…Public sector pay increases do not translate into higher inflation.’ [5]
The main UK inflation and price indices used for wage bargaining
The first UK cost-of-living index (COLI) was established in 1914 as a means of measuring the increase in the costs of basic subsistence items for workers during the First World War. The cost-of-living index measured the change in household expenditure necessary to maintain the same standard of living.
However, not all inflation indices were designed with the same intention and it is important to understand the different purpose for which each inflation measure was created. The most common measures of inflation and prices used in the UK today and published by the Office for National Statistics (ONS), include the:
-
Consumer Price Index (CPI);
-
Consumer Price Index, including owner occupiers’ housing costs (CPIH);
-
Retail Price Index (RPI).
Put simply, CPI and CPIH measure the change in the cost of goods and services that households are buying, whereas RPI measures the increase in expenditure needed to maintain a certain minimum standard of living.
The difference is significant, particularly during a recession. For example, poorer households typically substitute more expensive, often healthier food, with cheaper alternatives when their wages, pensions or benefits do not increase to match RPI inflation, i.e. when they are cut in real terms.
There are numerous differences between the RPI and CPI/CPIH inflation measures, but the result of this ‘substitution bias’ is that CPI/CPIH usually increases at a slower rate than RPI, since CPI/CPIH tracks the prices of the cheaper alternatives that people are buying, whereas RPI continues to measure the cost of the healthier, more expensive food in the original ‘basket of goods’.
Following wage freezes and real-terms pay cuts, such as those imposed on teachers since 2010, if wages, pensions and benefits do not increase at a rate to match RPI inflation, those households will no longer be able to afford those more expensive and healthier options. In our current circumstances, living standards will be forced down permanently unless teachers’ pay is restored in ‘real terms’ to the levels that they used to be in 2010. This means calculating what teachers’ pay would have been if it had increased in each year since 2010 to match inflation as measured by RPI.
RPI tends to be higher than CPI and CPIH since it is designed to maintain living standards, whereas CPI/CPIH are not. CPI tracks the cost of goods commonly purchased and takes no account of housing costs whatsoever.
It is for this reason that Eurostat, who created the ‘international standards’ that govern CPI, stated that this type of inflation measure should not be used to set pay awards.
CPI is an accurate measure of consumer behaviour, designed to assist European banks to set interest rates and meet the international standards to join the euro (€) monetary union, but if CPI is used to set wages, pensions and benefits in our current economic circumstances, the living standards of UK workers, pensioners and the most vulnerable in society will be forced down even further and permanently and foodbank use will continue to rise.
CPIH utilises a method called ‘rental equivalence’ which effectively estimates the rents that owner occupiers would notionally pay for the properties they own. However, concerns persist with the highly experimental method of estimating housing costs used in CPIH and it remains widely ignored by statisticians and the media as a reliable measure of inflation due to these continuing deficiencies.
Below-inflation pay awards force people into poverty and foodbank use. This is why NASUWT uses the RPI inflation measure and calls for teachers’ salaries to be restored in real terms to 2010 levels to protect teachers’ living standards.
The CPI versus RPI debate
No single inflation measure is suitable for all purposes. CPI and RPI are compiled to meet two different objectives. CPI is a macroeconomic inflation-targeting indicator designed for the EU to assess whether a country is ready to join the euro monetary union. RPI was devised as a measure of inflation experienced by UK households, excluding both high-income and low-income pensioner households.
RPI is a true cost-of-living index, since it measures the change in minimum household expenditure needed to maintain a given standard of living.
The Royal Statistical Society (RSS) stated in 2017 that the CPI and CPIH ‘are an unsatisfactory measure of inflation as it affects British households’.
So why does the UK Government use an inflation measure designed to assess a country’s readiness to join the euro (€) and European monetary union to determine increases to UK workers’ pay, benefits and pensions?
The simple answer is because CPI produces a lower rate of inflation than RPI.
In June 2010, Chancellor George Osborne, in the first budget of the Conservative-Liberal Democrat Coalition Government, announced measures including that:
-
CPI would be used in place of RPI for the uprating of some benefits with effect from April 2011;
-
public sector workers would face a two-year pay freeze; and
-
the Government would accelerate the increase in the state pension age to 66.
These strict austerity measures were introduced to reduce public spending by over £6 billion in each year within the five-year term of the Parliament.
In the Autumn Statement in 2011, a change linking teachers’ pension increases to CPI indexation, removing RPI indexation with effect from April 2011, reduced the value of teachers’ pensions in payment, ‘estimated in a typical 21-year retirement period to result in a 17.7% reduction in teachers’ pension benefits’.
NASUWT rigorously opposed the change and mounted an unprecedented legal challenge against the Government in both the High Court (October 2011) and the Court of Appeal (February 2012). The Appeal Court ruled in the Government’s favour stating that it was entitled to select the less favourable CPI index to uprate teachers’ pensions because it was in accordance with Government economic policy.
A comprehensive analysis of the methodological differences between the CPI and RPI measures of inflation and the political debate that has ensued since 2010 can be found in Dr Mark Courtney’s (former Head of Economics in the Regulatory Impact Unit, Cabinet Office), seminal paper Consumer Price Indices in the UK. [6] Dr Courtney’s paper systematically dismantles the statistical arguments against RPI that have been propagated by the IFS and others following the 2015 Johnson Review and his evidence to the House of Lords Economic Affairs Committee (EAC) [7] was instrumental in shaping their recommendation for the RPI measure to be improved and continued.
No single inflation measure is suitable for all purposes. RPI is a true cost-of-living index, since it measures the change in minimum household expenditure needed to maintain a given standard of living. The ONS should reclassify RPI as an official national statistic and make the improvements recommended by the House of Lords Economic Affairs Committee (EAC) to ensure that it remains relevant and fit for purpose.
Footnotes
[1] NASUWT | Big Question Survey Report 2025
[2] Don’t ask for a big pay rise, warns Bank of England boss - BBC News, 4 February 2022
[3] Rishi Sunak says public sector pay rises will fuel inflation. Economists say they won’t | Politics News | Sky News, 4 January 2023
[4] Paul Johnson, Director of the Institute for Fiscal Studies, ‘It is not true...that giving public sector workers a bit more would significantly raise inflation’, 15 March 2023
[5] Paul Whiteley, Emeritus Professor of Government, University of Essex, Does public sector pay drive inflation? Does public sector pay drive inflation? | British Politics and Policy at LSE, 21 February 2023
[6] Dr. Mark Courtney, Consumer Price Indices in the UK, 2016
[7] House of Lords, Economic Affairs Committee, Measuring Inflation, 2019
Calculations
- Salary figures are based upon the statutory and recommended salary values for classroom teachers who are paid on the main and upper pay ranges in accordance with the School Teachers’ Pay and Conditions Document 2025 (STPCD 2025) Annex 3.
- Inflation data is based on the Office for National Statistics (ONS) published Retail Prices Index (RPI): All items: 12 months % change for the corresponding year in each September.
- The ‘real-terms pay cut’ figure is the difference between what a teacher will earn in 2025/26 and the amount that they would have earned in 2025/26 if the salary point on which they are paid had increased to match RPI inflation since 2010.
- The ‘total real-terms pay cut since 2010’ is the total sum difference between the actual salary point value in each year since 2010 and the salary point value in each year since 2010 if it had increased in each year to match RPI inflation.
- The pay data above highlights the impact of the Conservative Government’s imposed pay freezes and successive below-inflation pay awards for teachers since 2010 and the Labour Government’s pay awards since 2024.
Anonymous feedback
If you require a response from us, please DO NOT use this form. Please use our Contact Us page instead.
In our continued efforts to improve the website, we evaluate all the feedback you leave here because your insight is invaluable to us, but all your comments are processed anonymously and we are unable to respond to them directly.