
The NASUWT Big Question Survey, carried out in February and March each year, is the only annual national survey of teachers and headteachers tracking trends in teachers’ and school leaders’ opinions
The 2025 Big Question Survey was completed by 10,626 teachers from across England, Wales, Scotland, Northern Ireland and the Crown Dependencies.
Our report below outlines some headline data from the Big Question Survey. You can Explore the Data in more depth or download the report on the right/below.
Some key facts
Infographic showing some key facts, stats and figures taken from the 2025 survey.
Sections 1-4
In sections 1-4, we look at pay and pensions, pupil health and wellbeing, working practice and pupil behaviour, and bureaucracy and workload.
Sections 5-8
In sections 5-8, we look at teaching quality, technology, health and wellbeing, and job satisfaction.
Pay and pensions
Pupil health and wellbeing
Working practice and pupil behaviour
Bureaucracy and workload
Pay and pensions
Over the last 12 months, teachers have continued to report deep concerns about pay and financial pressures, although there are some positive movements compared to last year.
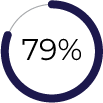
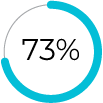
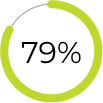
For instance, the proportion of teachers who do not believe that teaching is competitive with other professions has fallen again, down four points to 79%, while those who feel they are not paid at a level commensurate with their skills and experience has also declined slightly to 73%.
Similarly, fewer teachers now say that pay deters people from entering the profession, although it should be noted that three quarters still believe it remains a significant barrier.
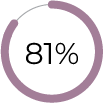
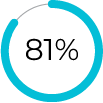
Levels of financial anxiety remain high across the profession, with 81% of teachers saying they are worried about their financial situation - only a marginal decrease on last year - underlining the ongoing strain that low pay continues to exert.
Additionally, concerns about affordability of pensions remain, though the percentage of teachers who find costs unaffordable has dropped slightly to 24%.
There are further signs of easing pressures in day-to-day spending. Fewer teachers report cutting back on essentials such as heating (down ten points to 34%), food (down six points to 47%) and clothing (down four points to 66%). The number of teachers who have had to stop saving has also edged down to 56%.
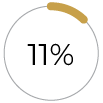
However, the absolute numbers remain stark: nearly three quarters have cut back on social activities, nearly half have had to cut back on food, and over one in ten still say they have been forced to take a second job.
While there are modest improvements across a number of measures, the overall picture continues to show a profession under severe financial pressure, with high levels of worry, widespread personal cutbacks, and significant concerns about the competitiveness of teaching compared to other professions.
| Q18 |
|
do not think that teaching is competitive with other professions |
|---|---|---|
| Q19 |
|
do not believe they are paid at a pay level commensurate with their skills and experiences |
| Q20 |
|
believe that people are put off a career in teaching because of pay |
| Q21 |

|
find their pension costs unaffordable |
| Q22 |
|
are worried about their financial situation (somewhat/very worried) |
Q23 In the last 12 months, have you had to do any of the following:
| 73% | Cut back on social activities |
|---|---|
| 66% | Cut back on expenditure on clothing |
| 34% | Cut back on expenditure on heating |
| 47% | Cut back on expenditure on food |
| 56% | Stop saving |
| 43% | Delay household repairs |
| 33% | Cut back on expenditure on essential household items |
| 33% | Reduce contributions to charity |
| 22% | Increase use of credit |
| 15% | Increase overdraft |
| 11% | Take a second job |
| 8% | Delay the paying of bills |
| 3% | Miss mortgage or rent payments |
| 1% | Visit a foodbank |
Pupil health and wellbeing
The responses to questions about pupil health and wellbeing and safeguarding remain largely consistent with last year.
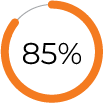
Almost all teachers report teaching pupils with mental health challenges and 85% say rates of adverse emotional, personal or social issues have increased over the past 12 months.
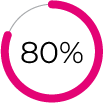
Eight in ten teachers continue to say that appropriate support is not available to address pupils’ mental health needs. Just over half report that safeguarding referrals have increased over the last year, while 81% feel supported to make safeguarding referrals within their school.
For the first time, the survey asked about types of provision for pupils with special educational needs and disabilities (SEND) or additional needs.
Over half of teachers report their school has a resourced provision or SEN unit and almost four in ten have internal alternative provision.
Fewer than half say that pupils in these provisions are reintegrated into mainstream classes, highlighting ongoing challenges in ensuring all pupils receive the support they need.
| Q24 |
|
believe that the rates of adverse emotional, personal or social issues among pupils they teach have increased over the last 12 months |
|---|---|---|
| Q25 |
|
don’t believe that appropriate support is available to help address pupils’ mental health issues |
| Q26 |
|
fulfil a safeguarding lead role in their school |
| Q27 |

|
say that the number of safeguarding referrals made has increased (slightly/significantly) over the last year |
Q28 Teachers who say that the number of safeguarding referrals made has increased (slightly/significantly) by type:
| 16% | Sexual abuse |
|---|---|
| 25% | Physical abuse |
| 34% | Emotional abuse |
| 34% | Neglect |
| Q29 |
|
feel supported (moderately/very) to make safeguarding referrals within their school |
|---|
Q30 Teachers who say their school has an internal resourced provision or SEN Unit for pupils with SEND:
| 55% | Yes, run by my school |
|---|---|
| 2% | Yes, run on site by external organisation |
| 1% | Yes, run remotely by external provider |
Q31 Teachers who say their school has internal alternative provision for pupils (e.g. pupils who have been suspended, are in seclusion, have anxiety issues):
| 39% | Yes, run by my school |
|---|---|
| 2% | Yes, run onsite by external organisation |
| 2% | Yes, run remotely by external provide |
| Q32 |

|
say that their school ensures that pupils attending internal resource provision are reintegrated back into main school classes |
|---|
Working practice and pupil behaviour
Pupil behaviour continues to be a significant concern for teachers.
The most commonly reported issues remain the inability to follow rules, chatter in class, and irregular attendance, while failure to complete work, backchat, and late arrival at lessons also cause frequent disruption.
Worryingly, reports of physical assaults on teachers and misogynistic behaviour by pupils have increased slightly, although most other categories of poor behaviour are broadly stable compared with last year.
Incidents of pupils bringing weapons into schools remain rare but continue to worry teachers.
Teachers’ experiences of abuse or challenging behaviour from pupils and parents are similar to last year. However, a higher proportion of teachers feel that their school has not dealt with such incidents satisfactorily.
There have been small improvements in perceptions of support from schools, with slightly more teachers feeling empowered, resourced and supported in managing poor behaviour and a small increase in the number of schools completing risk assessments for violent or potentially violent pupils.
Concerns about school buildings remain, although slightly fewer teachers rate conditions as poor or deteriorated.
Persistent issues include extreme temperatures, leaking roofs, lack of ventilation, and limited welfare facilities, highlighting ongoing challenges in maintaining safe and suitable learning environments.
Q33 Pupil behaviour problems that cause the most concern on a day-to-day basis:
| 80% | Inability to follow rules |
|---|---|
| 67% | Pupils with irregular attendance patterns |
| 70% | Chatter in class |
| 65% | Failure to complete work, including homework |
| 66% | Backchat |
| 62% | Late arrival at lessons |
| 55% | Failure to bring appropriate equipment |
| 50% | Swearing/verbal abuse |
| 46% | Failure to comply with uniform policy |
| 34% | Distraction of mobile phones, e.g. texting, cameras |
| 29% | Discriminatory language |
| 29% | Violence between pupils |
| 26% | Bullying between pupils |
| 22% | Threatening behaviour |
| 20% | Physical assaults on teachers |
| 11% | Distraction of other portable electronic devices, e.g. iPad |
| 5% | Pupils bringing weapons into school |
Q34 Teachers in the last 12 months say they have been subject to:
| 62% | Verbal abuse by a pupil |
|---|---|
| 30% | Verbal abuse by a parent or carer |
| 27% | Criticism from parents/carers, including parent ‘bombing’ during remote education |
| 25% | Discriminatory language/abuse by a pupil |
| 24% | Pushing/shoving by a pupil |
| 21% | Threats of physical assault from a pupil |
| 20% | Misogyny by a pupil |
| 17% | Physical assault by a pupil |
| 8% | Discriminatory language/abuse by a parent or carer |
| 5% | Misogyny by a parent or carer |
| 3% | Abuse/allegations on social networking sites by a pupil |
| 3% | Threats of physical assault from a parent or carer |
| 3% | Abuse/allegations on social networking sites by a parent or carer |
| 2% | Sexual harassment by a pupil |
| 1% | Physical assault by a parent or carer |
| 1% | Sexual harassment by a parent or carer |
| Q35 |

|
felt that their school had not dealt with abuse by a parent/carer or pupil in a satisfactory manner |
|---|
Q37 My experience in my current school (agree/strongly agree with statement):
| 41% | they are made to feel they are to blame for poor pupil behaviour |
|---|---|
| 45% | the culture in their school is that poor pupil behaviour is part of the job and they should expect to receive abuse/violence from pupils |
| 41% | they feel supported by their school’s approach to dealing with poor pupil behaviour |
| 29% | their school’s approach to pupil behaviour management empowers them as a teacher |
| 29% | they have the adequate resources, support and tools to address poor pupil behaviour |
| 59% | their school adopts a whole-school approach to behaviour management |
| 31% | their school’s behaviour policy is effective and fit for purpose |
| 33% | their school leaders have sufficient guidance to complete risk assessments for violent pupils |
Q38 Percentage of schools that complete risk assessments for violent/potentially violent pupils:
| 27% |

|
Yes - and shared with staff |
|---|---|---|
| 16% |

|
Yes - but not shared with staff |
| Q39 |

|
rate the condition of their school building as poor/very poor |
|---|---|---|
| Q40 |

|
say the condition of their school building has deteriorated/greatly deteriorated over the past three years |
Q41 Concerns about conditions of school buildings:
| 72% | Extremes of temperature |
|---|---|
| 44% | Leaking roofs |
| 43% | Lack of ventilation |
| 46% | Lack of welfare facilities (toilets, water, etc.) |
| 22% | Lack of general site security |
| 17% | Presence of asbestos |
| 14% | Loose/falling windows |
| 13% | Concerns around electrical supplies (broken sockets, exposed wires) |
| 13% | Loose/falling masonry |
| 8% | Concerns around fire safety (lack of extinguishers/fire exits/fire doors/fire alarms) |
Bureaucracy and workload
Teachers continue to face significant workload pressures, with almost half (48%) reporting a substantial increase over the past year.
Statistics
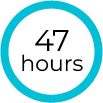
The average working week is 47 hours, including 12 hours outside the school day, with the greatest increases in time spent on administrative tasks, pastoral care, and data and assessment requirements.
Hours spent on classroom teaching, lesson preparation, marking, and remote education have remained relatively stable.
Overall, while the types of tasks have not changed dramatically, the continued high workload - especially time spent on non-teaching activities - remains a major challenge for teachers, highlighting the ongoing need for support and manageable workloads within schools.
| Q42 |

|
say workload has increased significantly |
|---|---|---|
| Q43 |
|
hours worked in a typical mid-term week |
| Q44 |

|
hours worked in a typical mid-term week outside of school day |
Q45 Change in time spent on activities (% saying more/much more time):
| 68% | Administrative and clerical tasks |
|---|---|
| 63% | Pastoral care |
| 56% | Dealing with parents |
| 58% | Data and assessment requirements |
| 45% | Lesson planning |
| 38% | Classroom teaching or supervision and related preparation |
| 39% | Marking |
| 10% | Remote education/distance learning and related preparation |
Teaching quality
Technology
Health and wellbeing
Job satisfaction
Teaching quality
Half of teachers report not feeling managed in a way that empowers them, with key factors contributing to professional disempowerment including:
-
constant change (62%);
-
lack of understanding from decision-makers (59%); and
-
insufficient respect for teachers’ professional judgement (59%).
Other notable pressures include unreasonable expectations, a culture of blame, and insufficient support when challenges arise, highlighting persistent systemic challenges that limit teachers’ autonomy and professional confidence.
Threats or involvement in capability procedures remain relatively low (7% threatened, 5% subject to procedures), while respect for professional judgement shows slight improvement (30% feel it is not respected).
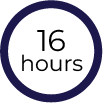
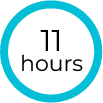
Access to continuing professional development (CPD) has decreased, with teachers reporting 16 hours in contracted time and 11 hours in their own time, alongside a small reduction in refused CPD requests (16%) and self-funding (8%).
| Q46 |

|
do not feel managed in a way that empowers them |
|---|
Q47 Factors that professionally disempower (% agreeing):
| 62% | Constant change |
|---|---|
| 59% | A lack of understanding by decision-makers of the day-to-day realities of the job |
| 59% | Lack of respect for teachers’ professional judgement |
| 50% | Unreasonable or unrealistic expectations |
| 50% | Teachers’ views are not sought or listened to |
| 46% | A culture of blame/criticism rather than praise |
| 42% | Offensive behaviour from pupils/parents, or colleagues not being tackled by management |
| 40% | Lack of timely support and intervention when teachers experience difficulty |
| 32% | Punitive accountability, e.g. inspection/external moderation/league tables. |
| 35% | Teachers are deployed to teach subjects/groups for which they have had no training |
| 36% | Excessive monitoring of teachers |
| 35% | Lack of access to appropriate CPD/Professional Learning (PL) |
| 31% | Imposed individual pupil targets |
| 28% | Teachers are restricted in the teaching methodologies they are able to use |
| Q48 |

|
have been threatened with capability procedures in the last 12 months |
|---|---|---|
| Q49 |

|
have been subject to capability procedures in the last 12 months |
| Q50 |

|
have been offered or put on a support programme in the last 12 months |
| Q51 |

|
think that the professional judgement of teachers about the needs of their pupils is not respected in their school |
| Q52 |
|
hours CPD accessed over the last year in contracted time hours CPD accessed over the last year in own time |
| Q53 |

|
have had CPD requests refused in the past 12 months |
| Q54 |

|
have had to fund/part-fund their CPD |
Technology
The 2025 survey focused on questions that highlight the growing integration of technology in schools, particularly remote education and artificial intelligence (AI).
Nearly half of teachers report that their schools continue to provide remote learning for unplanned closures (48%), pupils in seclusion (45%), and those who have been suspended (44%).
Remote activities are also being used to support pupils with mental health needs (32%), those with SEND/ALN who struggle socially (31%), and school-phobic pupils (27%).
AI is increasingly being adopted in teaching practice, with 43% of teachers using it for lesson planning, 28% for administrative tasks, 15% for delivering teaching, and 6% for marking.
Many teachers (71%) report that AI has reduced the time spent on certain tasks, allowing them to focus on other essential work, though only 7% feel it has reduced their overall workload.
Despite this, only a small proportion of staff (7%) are given dedicated time to train and prepare for using digital and AI-enabled technologies, indicating a need for greater structured support in this area.
Q55 Instances in which schools continue to provide remote education/distance learning/remote activities:
| 48% | Unplanned school closure days |
|---|---|
| 45% | Pupils who are in seclusion/isolation |
| 44% | Pupils who have been suspended |
| 35% | Parents’ evenings |
| 32% | Pupils with mental health needs (e.g. anxiety) |
| 31% | Pupils with SEND/ASN/ALN who struggle with the social aspects of school |
| 27% | Pupils who are school-phobic |
| 8% | Pupils in another school to access curriculum subjects not taught at their school |
| 7% | Pupils in several groups to be taught at the same time |
| Q56 |

|
use AI for lesson planning and preparation (Yes, occasionally/Yes, frequently) |
|---|---|---|
| Q57 |

|
use AI for delivering teaching (Yes, occasionally/Yes, frequently) |
| Q58 |

|
use AI for marking students’ work (Yes, occasionally/Yes, frequently) |
| Q59 |

|
use AI for other administrative tasks (Yes, occasionally/Yes, frequently) |
Q61 Implications of workload being reduced through using AI:
| 71% | Reduced time spent on certain tasks and used that time for other essential work |
|---|---|
| 9% | Reduced time spent on certain tasks but assigned new tasks |
| 7% | Reduced my overall workload |
| Q62 |

|
are given additional time to train and prepare to use digital technologies, including AI-enabled technologies |
|---|
Health and wellbeing
Teachers continue to report high levels of stress and adverse effects on both their mental and physical health.
Three in five teachers indicate that their physical health has been negatively affected by their job, while nearly four in five report impacts on their mental health.
Workload remains the primary factor contributing to poor mental health, though issues such as poor pupil behaviour and poor management continue to play a significant role.
New to this year’s survey, leadership initiatives and expectations from multi-academy trusts (MATs), local authorities and government have also emerged as notable stressors.
Common physical health issues include headaches and back pain, reported by over half of teachers, alongside neck pain and high blood pressure.
In response to these challenges, many teachers have sought support from friends, colleagues or line managers, though fewer report accessing professional or medical help.
There are minor improvements in perceptions of school attention to women’s health and wellbeing, with small increases in the presence of policies supporting menstrual health and menopause.
Overall, while some indicators show slight improvements from 2024, stress levels and the prevalence of work-related health impacts remain high.
| Q63 |
|
have experienced more workplace stress in the last 12 months |
|---|---|---|
| Q65 |
|
believe that the job has adversely affected their mental health in the last 12 months |
Q66 Factors that have been most important in causing adverse mental health (% saying most important):
| 44% | Workload |
|---|---|
| 34% | Poor pupil behaviour |
| 27% | Poor management |
| 21% | Leadership initiatives/expectations from the MAT or local authority |
| 18% | The wellbeing of my pupils |
| 18% | The academic performance of my pupils |
| 17% | Financial worries |
| 17% | Monitoring and accountability measures |
| 15% | Leadership initiatives/expectations from government |
| 15% | Job security |
| 12% | Workplace bullying |
| 8% | Discrimination |
Q67 In the last 12 months, have you experienced any of the following because of work (% agreeing):
| 83% | Anxiousness |
|---|---|
| 81% | Loss of sleep |
| 71% | Irritability/mood swings |
| 68% | Low energy levels |
| 51% | Lack of interest in other activities |
| 46% | Lower concentration levels |
| 38% | Poor health |
| 33% | Increased use of caffeine |
| 22% | Increased use of alcohol |
| 19% | Loss of appetite |
| 13% | Use/increased use of antidepressants |
| 11% | Poor or erratic timekeeping |
| 7% | Relationship breakdown |
| 6% | Use/increased use of prescription drugs |
| 5% | Increased use of tobacco |
| 2% | Self-harm |
| Q69 |

|
believe that the job has adversely affected their physical health in the last 12 months |
|---|
Q70 In the last 12 months, have you experienced any of the following because of work:
| 67% | Headaches |
|---|---|
| 52% | Back pain |
| 42% | Neck pain |
| 27% | High blood pressure |
| 17% | Other |
| 13% | Frequent nausea |
| 12% | Other musculoskeletal (MSK) disorders |
| 7% | Carpal tunnel syndrome |
Q72 If your job has negatively affected your mental/physical health in the last 12 months, have you done any of the following:
| 58% | Discussed the issues with a relative, colleague or friend |
|---|---|
| 47% | Spoken to a line manager/senior manager |
| 43% | Seen a doctor/medical professional |
| 40% | Taken medication |
| 17% | Spoken to your union representative |
| 16% | Undergone counselling |
| 14% | Sought any other professional help, e.g. physiotherapy |
| 4% | Been admitted to hospital |
| Q73 |

|
say that their school/college takes issues of women’s health and wellbeing seriously |
|---|
Q74 Teachers who say that their school/college has the following policies to support women’s health, safety and wellbeing:
| Q74 |


|
Menstrual health Menopause Other (responder specified) |
|---|
Job satisfaction
In 2025, teachers’ overall views of their profession show small improvements in some areas, though key challenges remain.
Slightly more teachers now feel that their classroom expertise is valued, and there has been a notable improvement in how good teachers perceive their school buildings and teaching spaces to be for pupils (+6 points).
Pride in one’s school has also increased (+4 points) and a small rise is seen in the proportion of teachers who would recommend teaching as a career (+1 point).
Despite these modest improvements, workload remains the top concern for teachers, affecting three quarters of respondents.
Pupil behaviour and indiscipline remain high on the list of worries and pay continues to be a significant concern.
Encouragingly, fewer teachers report being dissatisfied with their job or experiencing a decline in job satisfaction over the last year and slightly fewer are considering leaving their current post or the profession.
Work/life balance shows mixed results. Teachers are slightly better able to separate work and home life (+3 points) and relax at home (+1 point), while tiredness and pressure from family expectations remain high.
Levels of experienced discrimination or harassment at work have remained stable.
| Q75 |

|
would recommend teaching as a career |
|---|
Q76 About own school:
| 65% | My classroom expertise is valued |
|---|---|
| 66% | My school’s buildings and teaching spaces are fit to teach in |
| 63% | I am respected as a professional |
| 63% | My work is valued by parents |
| 61% | My safety is viewed as important |
| 66% | My school’s buildings and teaching spaces are good for pupils |
| 54% | My work is valued by school management |
| 54% | I am provided with the resources to enable me to teach effectively |
| 45% | My opinions are valued by school management |
| 42% | Students have access in school to high-quality ICT that supports their learning |
| 42% | My wellbeing is viewed as important |
| 26% | My school uses digital technologies, e.g. digital platforms, tablets, CCTV, to monitor teachers’ performance |
Q77 Views on own job:
| 84% | I work too hard for too little reward |
|---|---|
| 65% | I feel trusted to do my job |
| 63% | I feel my school gives me the freedom to teach to the best of my ability |
| 66% | I am proud to work at my school |
| 61% | I feel constantly evaluated and judged |
| 58% | I am held responsible for problems I have no control over |
| 57% | I feel I have control over what I do at work |
| 41% | I would recommend my school as a place of work to family/friends |
| 43% | I look forward to going to work |
| 38% | I feel that I would be able to request flexible working arrangements at my school |
Q78 Work/life balance statements:
| 82% | I feel too tired after work to enjoy the things that I would like to do |
|---|---|
| 72% | I find that my partner and/or my family/friends often get frustrated with the pressure of my job |
| 68% | I am often too worn down to give my job my best effort |
| 36% | I have the space to devote time to my partner or family/friends |
| 30% | I have been able to separate work and home life well since the start of the pandemic |
| 28% | I am able to relax at home and to switch off from my work |
| Q79 |

|
experienced discrimination at work in the last 12 months |
|---|---|---|
| Q80 |

|
experienced harassment from a colleague or manager at work in the last 12 months |
Q81 Top five things that teachers like most about their job:
| 90% | Interacting with pupils |
|---|---|
| 84% | Seeing children/young people learn and progress |
| 81% | Teaching |
| 79% | Making a positive difference |
| 45% | Support from colleagues |
Q82 Top five concerns:
| 76% | Workload |
|---|---|
| 70% | Pupil behaviour/indiscipline |
| 52% | School budget cuts |
| 46% | Pay |
| 31% | School inspection |
| Q83 |

|
are not satisfied/very dissatisfied with their job |
|---|---|---|
| Q84 |

|
say that their job satisfaction has declined in the last 12 months |
| Q85 |

|
have seriously considered leaving their current job |
| Q86 |

|
have considered leaving the teaching profession |
Anonymous feedback
If you require a response from us, please DO NOT use this form. Please use our Contact Us page instead.
In our continued efforts to improve the website, we evaluate all the feedback you leave here because your insight is invaluable to us, but all your comments are processed anonymously and we are unable to respond to them directly.