Longevity and the teachers’ pension age
In 2013, the Westminster Government enacted legislation to impose the reformed Teachers’ Pension Scheme (TPS) on the teaching profession in Scotland, Wales and England, which equalised the state pension age and the normal pension age for teachers. This was followed in 2014 by parallel legislation in Northern Ireland, which equalised the teachers’ and state pension ages in the same way.
The Conservative Government announced in July 2017 that it intends to raise the state pension age and therefore the teachers’ pension age even further, once it can find the parliamentary time to do so, increasing the number of teachers who will have to work until 68 to receive a state pension and a full teachers’ pension.
As the following chart demonstrates, the UK has the highest pension age out of the OECD nations, before any future increase takes effect:
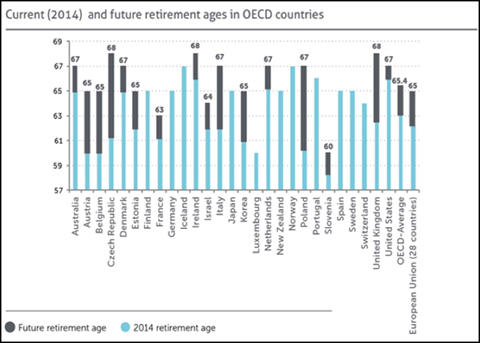
This remains unacceptable to the NASUWT and we continue to take action and campaign against the increased pension age.
The pretext for the increased pension age was the report of the Independent Public Service Pensions Commission, led by Lord Hutton, which reported in March 2011. This was also known as the Hutton Review.
The Hutton Report claimed that ‘rising longevity’ was ‘the main risk to the sustainability of public service pensions’. Hutton recommended that, to be ‘affordable and sustainable,’ the teachers’ pension age should increase so that it is in line with the state pension age. Hutton also stated that the link between the state pension age (SPA) and the public service pension age should be regularly reviewed, to ‘make sure it is still appropriate, with a preference for keeping the two pension ages linked.’ [1]
The Government and Lord Hutton quoted data on improved life expectancy to support their case for an increase in the pension age for teachers and other public sector workers. The NASUWT argued that making assumptions that life expectancy would improve year on year and that teachers could therefore work longer was simply unrealistic. The NASUWT has repeatedly presented this position to the Government since 2011 and also when it engaged with John Cridland over his review of the future of the state pension age in 2016/17.
In 2018/19, the Government carried out the second quadrennial valuation of public service pension schemes across the UK and the provisional results revealed that the pretext adopted by Hutton and the Government, of improving life expectancy trends which then necessitated reform of public sector workers’ pensions, was false. The longevity and mortality data used by the Government Actuary’s Department (GAD) in its valuation of the UK teachers’ pension schemes carried out in 2018/19 revealed that austerity had taken its toll and that working people were not likely to live as long as the Government had predicted before 2015.
ONS mortality and life expectancy data
In August 2018, the Office for National Statistics (ONS) published a study of changing trends in mortality from 1981 to 2016, which included a cross-UK comparison of mortality and life expectancy data. [2]
Overall, the ONS study concluded that, ‘after decades of steady improvements, increases in life expectancy in the UK in recent years have visibly slowed.’ In addition, for key social groups, such as people in the devolved nations, women and people between 15 and 54, mortality has worsened.
Mortality rates are calculated by dividing the number of deaths by the population. The statistics for this are then compared through time.
The key aspects of this are:
-
from 2011 to 2016, life expectancy at birth for women in the UK increased by 0.2 years from 82.7 to 82.9 years, compared with an increase of 1.2 years over the previous period from 2006 to 2011;
-
from 2011 to 2016, life expectancy at birth for men in the UK increased by 0.4 years from 78.8 to 79.2 years, compared with an increase of 1.6 years in the previous period from 2006 to 2011;
-
between 2011 and 2016, mortality rates for women worsened (increased) in Wales and did not improve in Northern Ireland. In England and Scotland, mortality rates decreased slightly for women, but by substantially less than in the previous period;
-
mortality rates for men and women between 15 years and 54 years across the UK worsened since 2012;
-
mortality rates for England have been the lowest of the UK nations from 1981 to 2016, whilst mortality rates for Scotland have been the highest.
The impact of worsened mortality
The 2018 ONS data, showing the worsening of mortality since 2011, has had a significant impact on the valuation of UK public service pension schemes, including the TPS. It has reduced scheme liabilities because the future cost of pensions has been reduced as a result of teachers not living for as long as the Government predicted when the UK teachers’ pension schemes were valued in 2014/15.
Combined with the effect of teachers’ salaries not keeping pace with inflation since 2012 because of austerity, teachers’ pensions did not reach the value the Government intended as a result of TPS reform in 2015.
If the Government had followed the Regulations which it put in place in 2015 to determine the levels of teachers’ pensions, all teachers in the career average pension scheme would have seen a significant improvement in their pensions. In fact, on the TPS Advisory Boards across the UK, the NASUWT negotiated improved accrual, securing agreements on the boards of improvements in accrual of between 1/47 and 1/49 across the UK pension schemes, to come into line from 1st April 2019 onwards. This would have given a real improvement in pension benefits for hundreds of thousands of teachers because current accrual in the career average pension scheme is 1/57.
However, in January this year, the Chief Secretary to the Treasury announced that the improvements to all public service pension schemes, which had been negotiated on the scheme advisory boards across the UK, would be paused and would not take place.
The NASUWT believes that the Government’s actions to prevent improvements in public service pension scheme benefits amount to a betrayal of the promises which were made to public sector workers when their pension schemes were reformed in 2015.
In addition, worsening of longevity across the UK means that the increased pension age for teachers, supposedly necessary because of improvements in life expectancy, no longer has a rationale.
The NASUWT continues to press the Government to make the teachers’ pension age a scheme-specific flexibility which can be lowered in response to the need to improve pension scheme benefits and also in response to worsened life expectancy.
The NASUWT has succeeded in persuading the TUC to adopt this position and also make representations to the Government to try to secure the breaking of the link between the SPA and the normal pension age (NPA). The NASUWT will continue to argue for the restoration of the teachers’ NPA to 60.
The link between mortality and wealth
There is a strong correlation between mortality and the level of the pension which is received, as shown by the following graph showing men’s mortality:
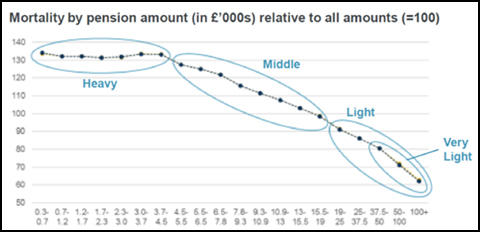
The horizontal axis is the level of pension and the vertical axis is the level of mortality, showing clearly that levels of mortality improve as the value of the pension increases. [3] A similar effect is shown for women’s pensions.
Do teachers who retire later die earlier?
It is a common ‘urban myth’ that teachers who work up to, or even beyond, their NPA are likely to die earlier than teachers who retire before their NPA. However, the very limited data available on this issue indicates that this is not the case.
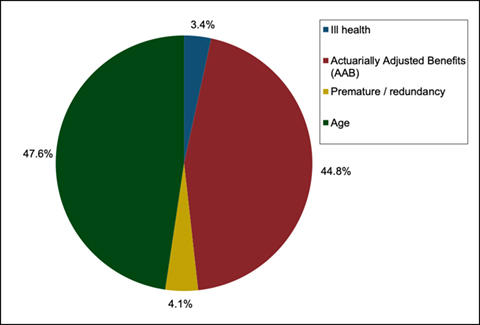
Department for Education (DfE) data [4] shows that between 2010 and 2014 in England, over 40,000 teachers retired, 44.8% of whom took actuarially adjusted benefits (AABs) so that they did not need to work to their current NPA, which for the overwhelming majority of those teachers would be 60. Only 47.6% of teachers worked to their NPA. (The remainder took phased retirement, ill-health benefits or a premature retirement package linked to voluntary redundancy.)
The age profile of teachers in 2014 was:
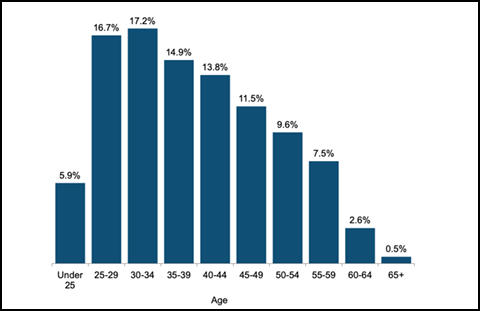
In total, 2.4% of classroom teachers worked beyond age 60, but this increased to 4.5% of headteachers, 0.7% of whom worked beyond age 65. [5]
Out of all retirees, the percentage of ill-health retirements was 3.4%. A teacher who is permanently unfit to teach is eligible for an ill-health pension after two years’ service, provided that they can demonstrate permanent incapacity up to their pension age, which would be 68 for a teacher in their 20s or 30s.
The eligibility criteria for a teacher’s ill-health pension presupposes a high level of incapacity and the most common grounds for teachers’ ill-health benefits are cancer (21%, alongside mental and behavioural disorders, also on 21%) and diseases of the nervous system (20%). Cancer and diseases of the nervous system are potentially degenerative, life-limiting conditions.
There are several factors, therefore, which influence the link between retirement age and life expectancy:
-
teachers who retire at very young ages tend to be the most seriously ill, often with life-limiting conditions;
-
many teachers who retire early and take actuarially reduced benefits (ARBs) may also be ill, but are deterred or are unwilling to apply for an ill-health pension and do not figure in the ill-health pension statistics. However, their life expectancy can be lowered;
-
headteachers, as the highest paid TPS members, tend to work for longer than teachers and, as life expectancy is closely correlated to the level of the pension, tend to have a higher life expectancy than lower paid teachers, even though teachers tend to retire earlier as a group.
The NASUWT will press the DfE for a full-scale study of the retirement age/life expectancy issue as part of the work of the TPS Advisory Board.
- Independent Public Service Pensions Commission Final Report, Recommendation 11.
- ONS, Changing trends in mortality: a cross-UK comparison, 1981 to 2016.
- TUC Pensions Conference 2019, Are we living longer?, Hilary Salt FIA.
- DfE, Teachers and ill-health retirement, Annex F; Analysis for the Teachers Working Longer Review, 2018.
- Ibid, table 5, page 25.